Published 5 November 2026. By Cheng Xu, BTO Radar. This guide combines a dated HDB data snapshot with explicitly hypothetical model examples. It is independent of HDB and MND.
What a BTO application rate tells you
An application rate describes demand relative to the flats available in a published application category and flat type. Check the category label: a first-timer family rate, a second-timer family rate and a singles rate describe different groups. The total applicant count divided by all units need not reproduce a category-specific rate because the category allocation can differ.
A rate of 4.0 means four applicants per available flat in the reported category. It does not, on its own, establish a particular household's chance of booking a flat. Applicants can have different ballot chances, priority schemes can affect allocation, and an invitation is different from securing a preferred unit. Use the category and ballot chances shown in your own HDB application.
A historical comparison: June 2026 four-room pools
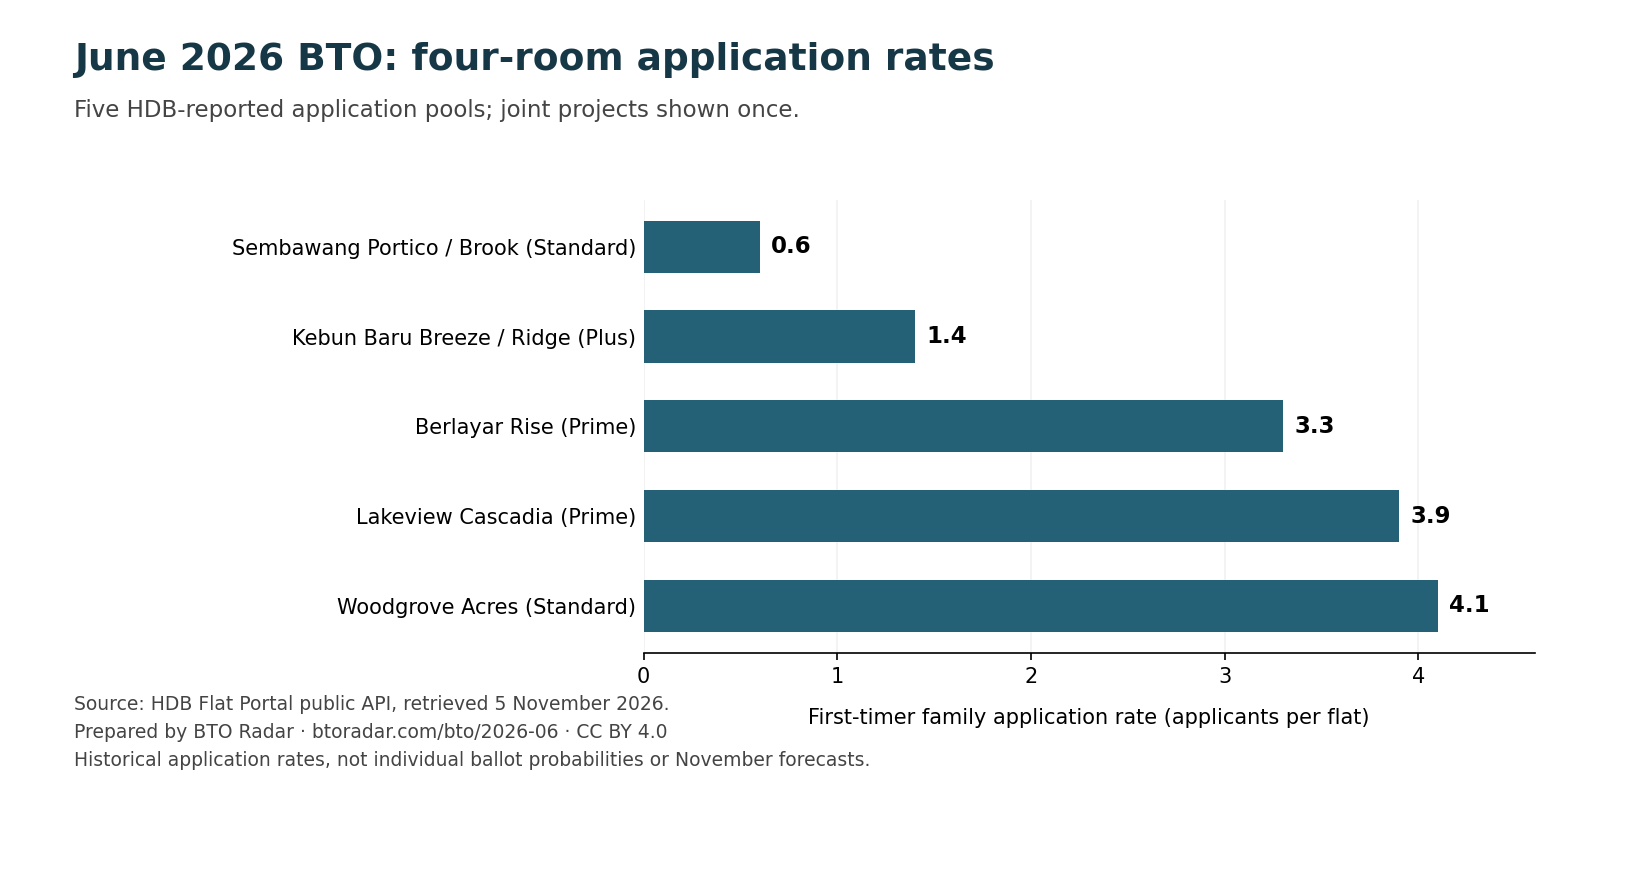
The table below preserves the five four-room application pools returned by HDB's public past-application-rate interface when retrieved on 5 November 2026. Two pools each cover a pair of projects; each pair is counted once. These are historical figures, not current November demand or forecasts.
| Project or joint pool | Classification | First-timer family rate |
|---|---|---|
| Sembawang Portico / Sembawang Brook | Standard | 0.6 |
| Kebun Baru Breeze / Kebun Baru Ridge | Plus | 1.4 |
| Berlayar Rise | Prime | 3.3 |
| Lakeview Cascadia | Prime | 3.9 |
| Woodgrove Acres | Standard | 4.1 |
Units: first-timer family applicants per flat in the published category. The two Standard pools sit at opposite ends of this five-pool comparison. A classification label alone is insufficient to describe the observed competition; this small table does not establish why the rates differed or predict another exercise.
The June launch page links to the individual projects. The figures here remain fixed to the retrieval date so that this article can be cited consistently. Later HDB corrections or newly collected exercises can appear on the launch pages without changing this historical table.
Why a reciprocal rate needs assumptions
In a simplified pool where all applicants have equal ballot weight, there are four applicants for each flat, and one invitation is available per flat, the model assigns each applicant an invitation probability of 1 / 4, or 25%. That is a mathematical illustration under equal-weight assumptions, not a published HDB probability.
Changing your ballot chances only has meaning relative to the other applicants. If every applicant's weight doubles together, their relative positions do not change. If applicant weights differ, a single reciprocal rate does not capture that difference.
A hypothetical example you can reproduce
Assume one simplified pool with four applicants per flat. Invent an applicant mix: 20% have one ballot chance, 60% have two, and 20% have three. Assume no invited applicants decline to book. Holding that same mix fixed, BTO Radar's weighted-random-order model gives:
| Your ballot chances | Model invitation estimate | Reproduce the inputs |
|---|---|---|
| 1 | 13.6% | One-chance example |
| 2 | 25.3% | Two-chance example |
| 3 | 35.5% | Three-chance example |
The mix is invented for teaching. It is not a measurement of HDB applicants, and the estimates are not forecasts for any named project. The calculator rounds its headline result to whole percentages. The methodology publishes the formula and assumptions.
What the model leaves out
- Category quotas and priority-scheme allocation are not simulated. Use category-specific source rates where available, but that does not reproduce the full official allocation process.
- Block, flat-type and unit preferences are not modelled. Being invited does not guarantee a preferred unit or a completed booking.
- Declines vary by exercise and project. A user-selected decline assumption changes the model; it is not an observed future decline rate.
- Exercise-specific rule changes and the actual mix of applicants may differ from the inputs. The model has not been validated against household-level ballot outcomes.
Official HDB eligibility information and ballot results take precedence. This guide is for understanding data and model assumptions, not deciding anyone's eligibility or providing personalised housing or financial advice.
A checklist before comparing projects
- Match the sales exercise, flat type and applicant category.
- Check the source date and whether the application window is still open.
- Keep joint project pools together; do not sum duplicate counts as independent demand.
- Treat blank category rates as unavailable or not applicable, not zero. A missing rate row also does not mean zero demand.
- Separate published observations from assumptions about future demand, applicant weights and declines.
Download, sources and citation
- Download the five-pool CSV.
- Download the chart PNG.
- Archived dataset with DOI: three exercises, 20 project records and 38 project/flat-type rate rows, retrieved on 5 November 2026. Shared pools can appear under multiple project records in the full export; this article's five-row CSV preserves each four-room pool once.
- Current BTO Radar public JSON: updates as collection succeeds; it is not the frozen article snapshot.
- Upstream source: HDB Flat Portal, public past-application-rate interface. The five CSV rows were checked directly against that interface before publication.
- BTO Radar methodology: collection checks, formula and limitations.
Suggested citation: Cheng Xu / BTO Radar (2026), How to read BTO application rates, published 5 November 2026, https://btoradar.com/guides/bto-application-rates . Chart and compilation: CC BY 4.0. Credit BTO Radar and retain HDB as the upstream source; no HDB endorsement is implied.
Prepared with AI assistance. The historical figures were checked against the HDB interface and the hypothetical examples were recomputed from the site's model. For corrections, contact BTO Radar and include the affected figure and its source.